Case Study: The Pygmalion Effect
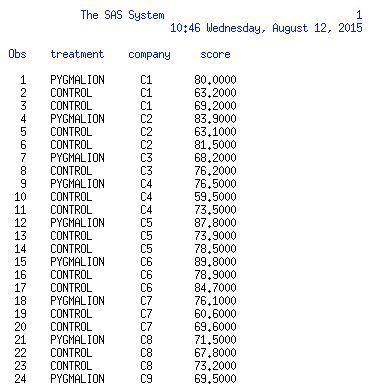
There are 10 army companies each with 3 platoons. One platoon is randomly picked for Pygmalion treatment and the other platoon are control groups. The platoon leader is told his platoon has scored highly on tests that indicate they are superior. After basic training, platoons are given a weapons test.
The response variable is an average score on basic weapons test per platoon.
There are two factors; company 10 levels(Company 1 ~ 10) and treatment 2 levels (Pygmalion, control) Therefore, there are 19 (=9+1+(9*1)) explanatory variables.
The data is following below.
Reference : Ramsey and Schafer (1997) The Statistical Sleuth, Duxbury Press, p. 365. The Pygmalion effect.
1. Two Way ANOVA with Interaction (Interaction Model & Hypothesis)
The model with interaction :
$Y_{i}=\beta_{0}+ \beta_{1}I_{pyg,i}+ \beta_{2}I_{comp1,i}+...+\beta_{10}I_{comp9,i}$
$+\beta_{11}I_{pyg,i}\cdot I_{comp1,i}+...+\beta_{19}I_{pyg,i}\cdot I_{comp9,i}+e_{i}$
$H_{0}:\beta_{11}=\beta_{12}=...=\beta_{19}=0$ (all possible interactions)
$H_{1}$ : at least $\beta_{1i}$ is not equal to 0
1.1 SAS Code and Result
We can create the Two-Way ANOVA by using proc glm. There are two factors; company and treatment. And we are also interested in interaction terms so that out model should be score=company | treatment, which | creates interactions. The another way to create interaction term is score=company treatment company*treatment.
In the interaction (company*treatment), the F value is 0.67 with high P-value (0.7221).
As we get a high P-value, we fail to reject the null hypothesis which means all possible interaction terms can be considered to 0. Therefore, our next model is an additive model which excludes the interaction terms.
2. Two Way ANOVA w/o Interaction. (Additive Model & Hypothesis)
The model w/o interaction:
$Y_{i}=\beta_{0}+ \beta_{1}I_{pyg,i}+ \beta_{2}I_{comp1,i}+...+\beta_{10}I_{comp9,i}$
2.1 The First Question - SAS Result and Conclusion
Our first question is there is a difference in mean score between Pygmalion and the control groups!!
$H_{0}:\beta_{1}=0$
$H_{1} : \beta_{1}$ is not equal to 0
As our interest is to find a difference between Pygmalion and the control groups, so we need to look at the treatment source. As we have a small P-value (0.0119), so we reject the null hypothesis which means there is a evidence of a difference in mean score between them.
Note that F value is distributed by F(# beta being tested, # degrees of freedom of SSE) = F(1,18)
However, in the diagnostics for score matrix, we can see a decreasing variance estimate pattern. Even though we have a small P-value, the evidence of our conclusion is week.
2.2 The Second Question - SAS Result and Conclusion
Our second question is there are differences in companies!!
$H_{0}:\beta_{2}=\beta_{3}=...=\beta_{10}=0$
$H_{1}$ : at least one $\beta_{2}...\beta_{10}$ is not equal to 0
As our interest is to find a difference among 10 companies, so we need to look at the company source. As we have a high P-value (0.1484), we fail to reject the null hypothesis which means there is no evidence of difference among companies.
Note that F(9,18) = F(# beta's being tested which are beta 2~10, # d/f of SSE)
Combining two question conclusion, our final model will be $Y_{i}=\beta_{0}+\beta_{1}I_{pyg,i}$
3. Model Checking
In the diagnostic panel, we can see whether our assumptions are satisfied or not.
There is no outliers, and normality looks ok. However, we have a concern of decreasing variance. Another assumption is independent observation which we assume that platoons were picked at random and were not interacting.


No comments:
Post a Comment