Case Study: The Spock Conspiracy Trial in SAS
The main question is there is evidence that women underrepresented on Spock judges venire when compared to other judges?
1. SAS Code
Please refer to the previous post how to read the data file by using infile code, and sort into two groups; 'SPOCKS' and 'OTHER' by using if statement. This SAS code demonstrates how to use proc glm for comparing two groups. The class statement in proc glm makes dummy variables. In order to print the estimates of the beta's, then we need to put the solution statement.
2. SAS Code - Output List
If you run the SAS code above, you can see the result list below. From the class statement, we can see there are two levels, Poscks and Other. And we need to focus on Type III model ANOVA and Solution.
3-(1). SAS Result - Class Levels
As you can see the result below, there are two levels created, Other and Spocks.3-(2). SAS Result - Least Squares Means
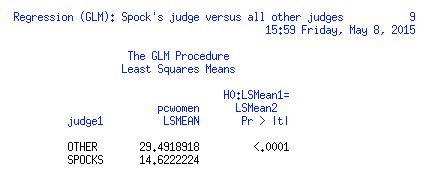
In this SAS output, we can see the least squares means for each level. Our hypothesis is that the LSMeans of the level Spock is equal to the LSMeans of the level Other.
3-(3). SAS Result - glm solution
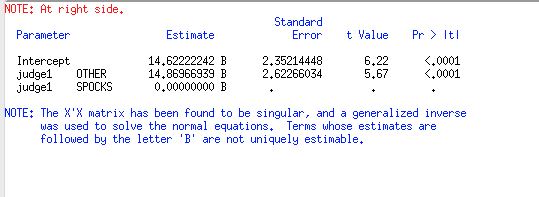
From the solution statement, we can get the
estimates of the each beta's. And each parameter has small p-values (less than
0.0001), so parameters are significant.
The equation will be pcwomen = 14.622 + 14.870*Other
The equation will be pcwomen = 14.622 + 14.870*Other
3-(4). SAS Result - Type III model ANOVA
F-value will be given in the Type III model ANOVA output. From the previous post regarding the two sample t-test in SAS, the pooled t-value was 5.67. Note that the squared pooled t-value is equal to the observed F value, which is 5.67*5.67=32.15.
4. Overall conclusion
In order to compare the means of the two groups, we can use two sample t-test, SLR with 1 dummy variable or one-way ANOVA with two groups by using different statements. Of course each method has the same conclusion!!


No comments:
Post a Comment